Learning Firebug, DOM Inspector, and JavaScript Shell
In learning Ajax and widgets/applications based on Ajax, I recommend using Firefox, the DOM Inspector, and the JavaScript Shell (bookmarklet) to manipulate live web pages and widgets. This combination allows for live interaction with the little apps; you can load a running map, analyze the details of how it is working while running, and issue commands that take immediate effect.
![[Note]](../docbook_images/note.png) | Note |
|---|---|
Even if you work primarily in a web browser other than Firefox, you can still gain a tremendous amount of insight about JavaScript programming using the Firefox-based tools. |
Moreover, the right tools can help you make sense of complicated stuff such as the Browser Object Model and the Document Object Model (DOM) by letting you interact with the browser, test code, and so on. I will use these tools in the rest of the chapter to support this experimental/reverse-engineering approach.
Using the DOM Inspector
The DOM Inspector allows you to look at the HTML DOM as a tree and make changes in that DOM. The DOM Inspector comes with Firefox but is not installed by default in Windows. To install it in Windows, you need to choose explicitly to install the DOM Inspector in the installation process. Consult the following documentation to learn how to use the DOM Inspector:
http://kb.mozillazine.org/DOM_Inspector
Remember, you can invoke the DOM Inspector by selecting Tools → DOM Inspector from the Firefox menu.
Using the Firebug Extension for Firefox
I highly recommend installing the Firefox add-on called Firebug. In many ways, Firebug is an enhancement of the DOM Inspector. In addition to being able to view and edit the contents of the DOM, you also get some very nice JavaScript debugging functionality.
To install this extension in Firefox, navigate to http://getfirebug.com, give permission to Firefox to install the
extensions from that domain, and then install the extension. (As with installing all
Firefox add-ons, you need to restart the browser to complete the
installation.)
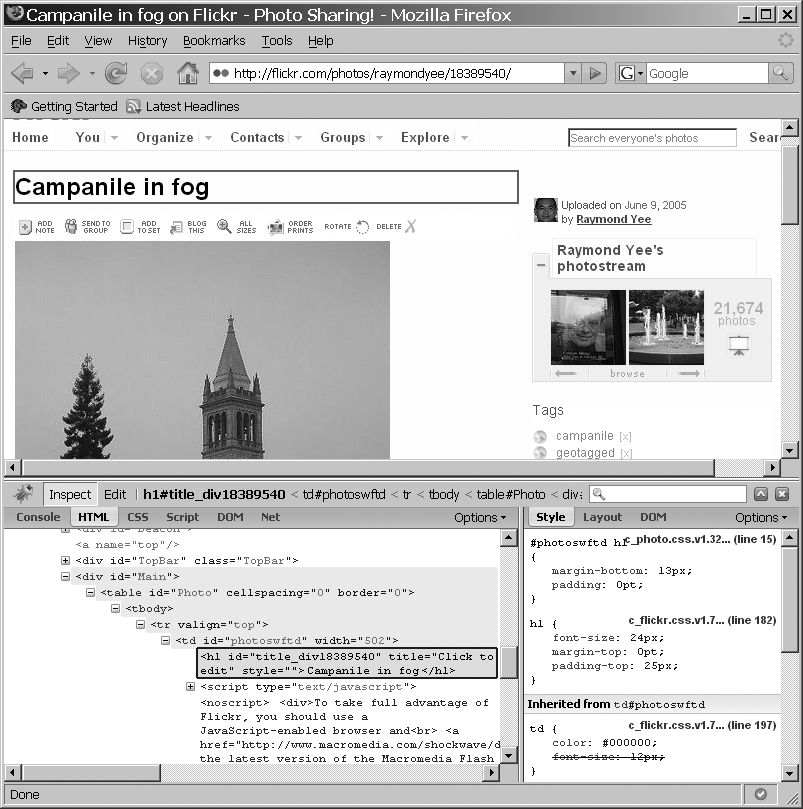
Figure 8-1 shows Firebug when I was using its Inspect HTML functionality to examine the title of a Flickr photo.
Figure 8.1. Figure 8-1.Firebug applied to a Flickr photo page. (Reproduced with permission of Yahoo! Inc. ® 2007 by Yahoo! Inc. YAHOO! and the YAHOO! logo are trademarks of Yahoo! Inc.)
Important features of Firebug include the following:
The ability to view live source (that is, what the HTML of the DOM is at the moment, not what the original source was).
Instant HTML editing (you can edit the HTML in Firebug and see the changes reflected on the page).
You can see the request and response headers, which is invaluable during debugging.
Firebug can therefore be useful for the following tasks:
Learning CSS by changing
<style>elements and seeing the effects (for example, the cascading process is shown, and overridden properties are struck out).Tracking uses of the
XMLHttpRequestobject (the object, which we will see in the next chapters, is the one often responsible for the exchange of XML or JSON by the browser). You can use Firebug to see whether and what data is actually being loaded.Using inspect mode to mouse over a piece of a web page and see the corresponding HTML.
Using the JavaScript Shell
The JavaScript Shell is a bookmarklet to use in Firefox that you can find at
https://www.squarefree.com/bookmarklets/webdevel.html. A
bookmarklet is a short piece of JavaScript that you can treat
like a browser bookmark but that does some function when you click it. With the
JavaScript Shell, you can run snippets of JavaScript code that will execute in the
context of the page in which you invoked the shell.
To install the JavaScript Shell, just drag it to your Links toolbar in Firefox. To invoke the JavaScript Shell, put the page you want in the foreground, and click the JavaScript Shell bookmarklet.